Real-World Experience
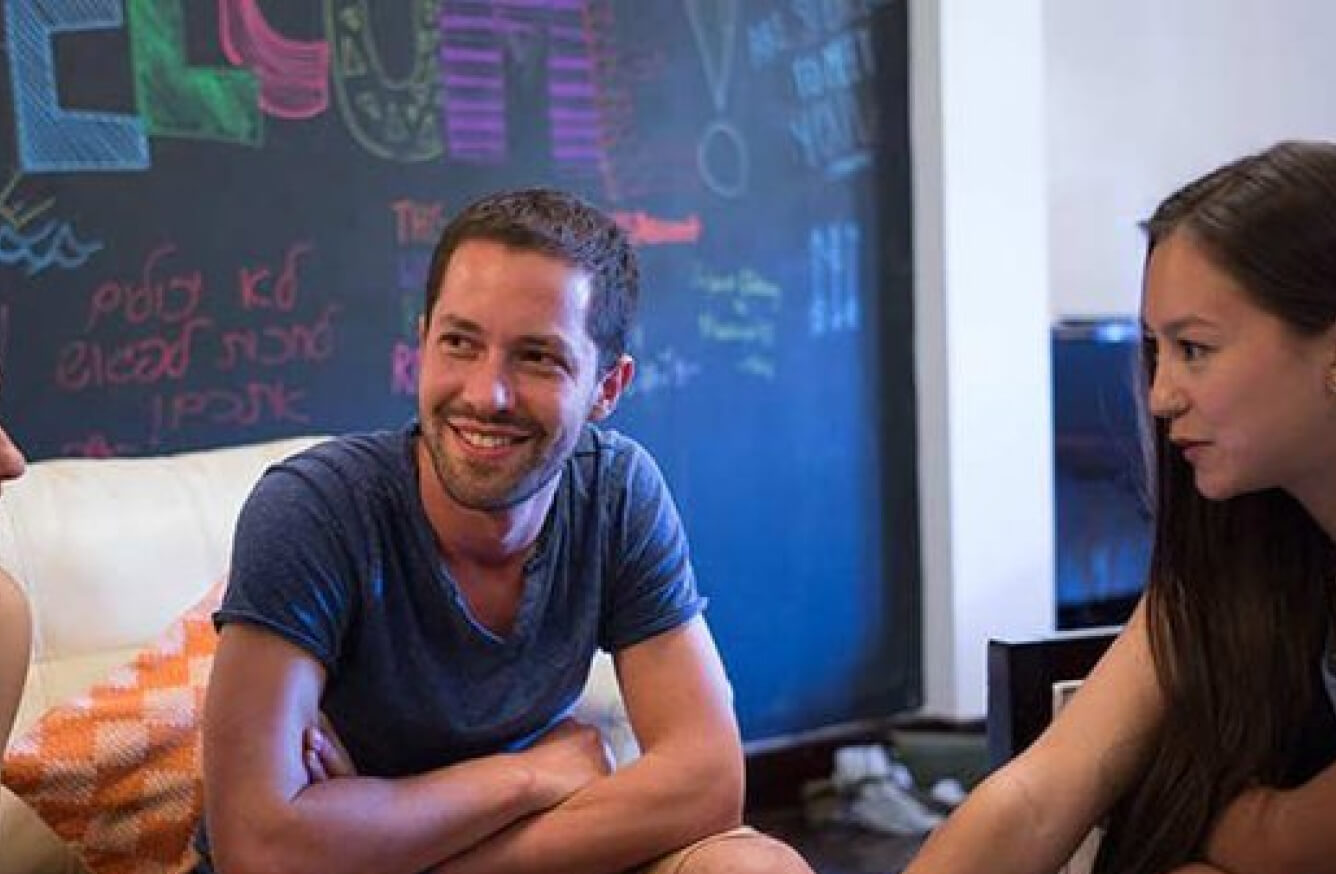
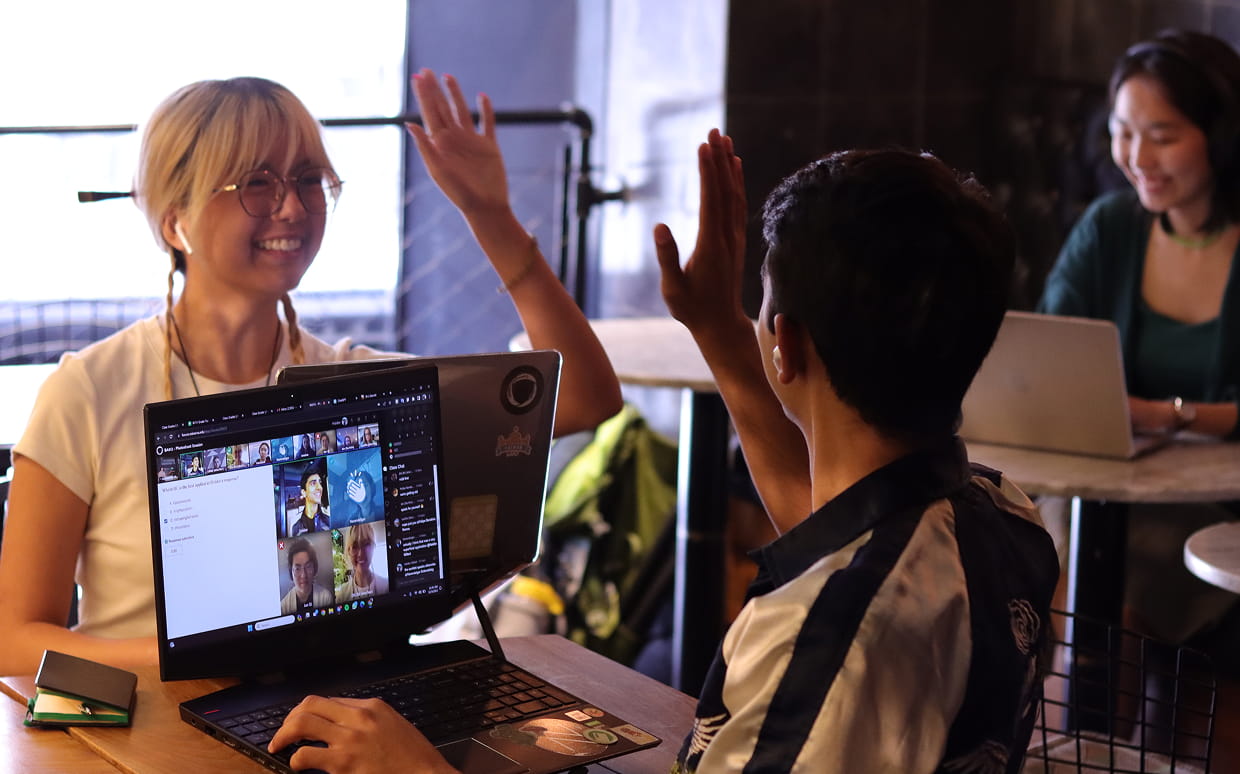
At Minerva, learning extends beyond the classroom into the cities, organizations, and communities where students live and study. Through applied projects, internships, research, and collaborative experiences, students connect academic learning to real-world challenges across global contexts.
Throughout their studies, students work in teams to tackle real challenges in collaboration with civic partners, organizations, and industry leaders. These experiences help students develop practical skills while learning how systems, organizations, and communities operate in practice.
Opportunities include:
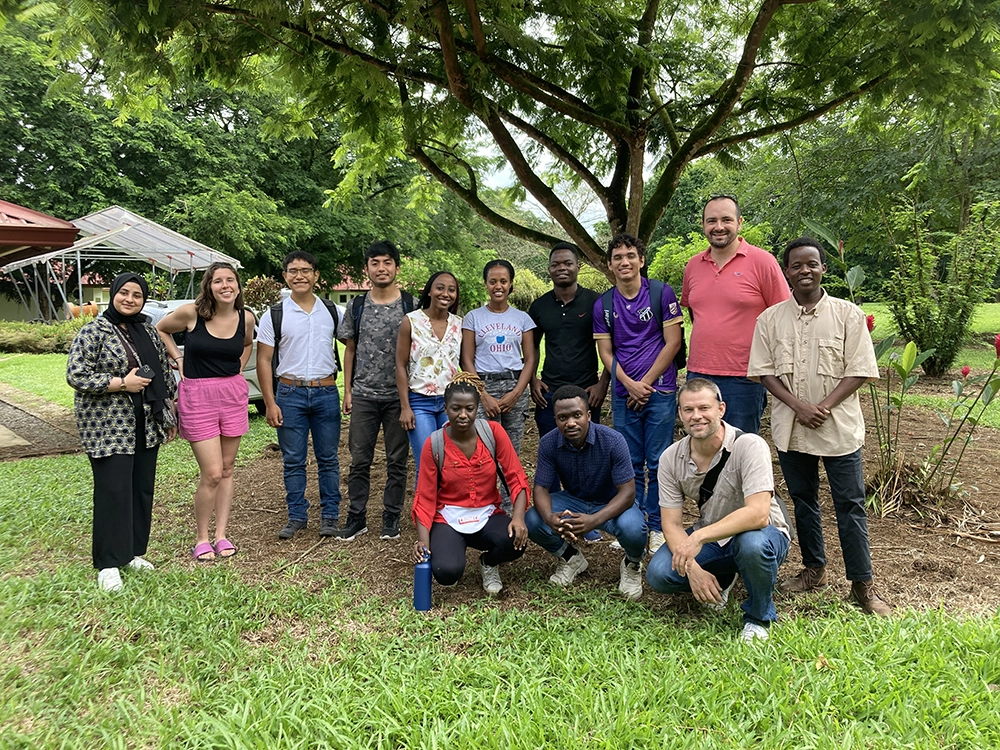
Team-based projects with local and global partner organizations
Work-study roles during the academic year
Research and project-based labs
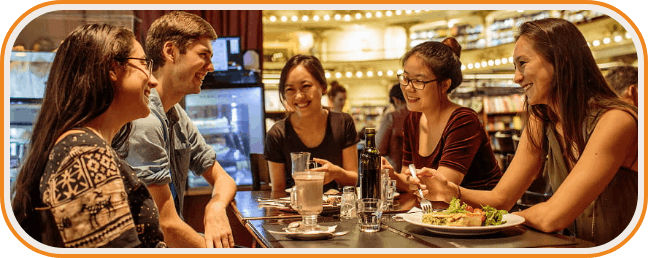
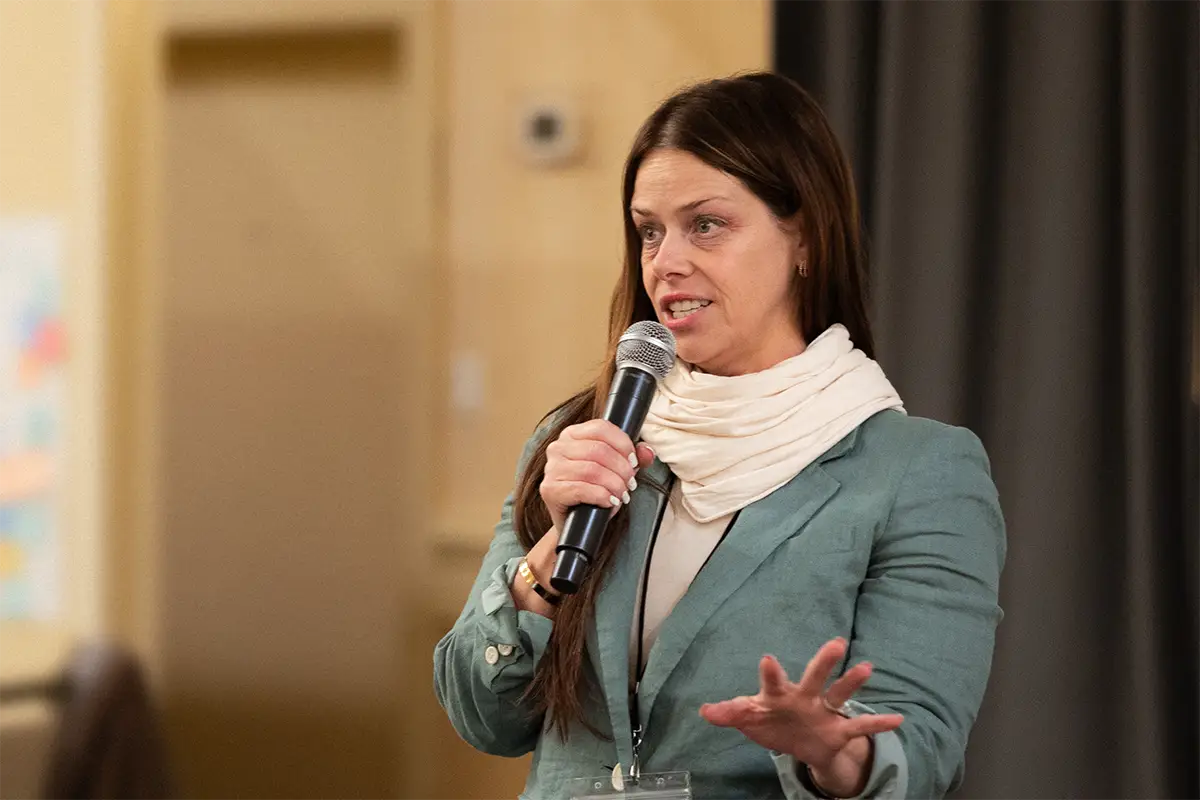
Along the way, students build relationships with professionals, receive mentorship, and create tangible work such as research, strategy recommendations, prototypes, or policy ideas.
By graduation, students have experience applying their skills in real-world contexts, not just concepts in theory.


.jpg)
.jpg)

.jpg)
.jpg)

.jpg)